
AI Agent Observability in Production: Monitoring & Tracing
Shipping an AI agent to a demo is easy. Keeping it healthy in production is a different job entirely. A single user request can fan out into a dozen model calls, three tool invocations, a retry loop, and a planner that quietly decides to do something you never anticipated. When that request fails, a stack trace tells you almost nothing. You need to see the whole reasoning path.
That visibility is what agent observability gives you. It is the practice of instrumenting an autonomous system so you can answer three questions after the fact: what did the agent do, why did it do it, and where did it go wrong. This guide walks through the pillars of agent observability and AI agent monitoring, how to instrument a real agent for agentic observability, the failure modes you will actually hit, and the tooling landscape as it stands in 2026.
What agent observability actually means
Agent observability is the ability to reconstruct and understand the internal behavior of an AI agent from the data it emits. It borrows the classic three pillars of observability, traces, metrics, and logs, and adapts them to systems whose control flow is decided by a language model at runtime rather than by code you wrote.
Traditional application monitoring assumes deterministic paths. You know function A calls function B, so a trace of that call is predictable. An agent breaks that assumption. The model chooses which tool to call, how many times to loop, and when to stop. Two identical inputs can produce two different execution graphs. Observability is how you cope with that non-determinism instead of being blindsided by it.
This matters more for agents because the failures are subtler. A REST endpoint returns a 200 or it does not. An agent can return a confident, well-formatted, completely wrong answer while every component reports success. Without visibility into the reasoning steps, you will never catch it.
Why AI agents break differently in production
Before instrumenting anything, it helps to know what you are hunting for. Because agentic behavior is decided at runtime, agentic workflows fail in ways ordinary services do not. Agent failures cluster into a handful of recognizable shapes, and each one leaves a different signature in your telemetry.
The first is the runaway loop. A planner keeps deciding it needs one more tool call, never converges, and burns tokens until it hits a step limit or a timeout. In your metrics this shows up as a spike in steps-per-run and token cost with no corresponding rise in successful completions.
The second is silent tool failure. A tool returns an error string, the model treats that string as valid data, and it reasons forward on garbage. Nothing throws. The run completes. The answer is wrong. You only see it if you are logging tool inputs and outputs and comparing them against expectations.
The third is context drift. On long-horizon tasks the agent gradually loses track of the original goal as its context window fills with intermediate results. The early steps look great, the later ones wander. Traces make this visible because you can watch the prompt grow and the relevance of each step decay.
The fourth is the cost blowout, which is less a correctness bug than an economic one. A change to a prompt or a model upgrade doubles token usage overnight, and you do not notice until the invoice arrives. This is why token and cost tracking belong in your monitoring from day one, not as an afterthought. For a deeper look at how these failures cascade and how to contain them, our guide on building fault-tolerant AI agent pipelines covers the recovery patterns in detail.
The three pillars applied to agents
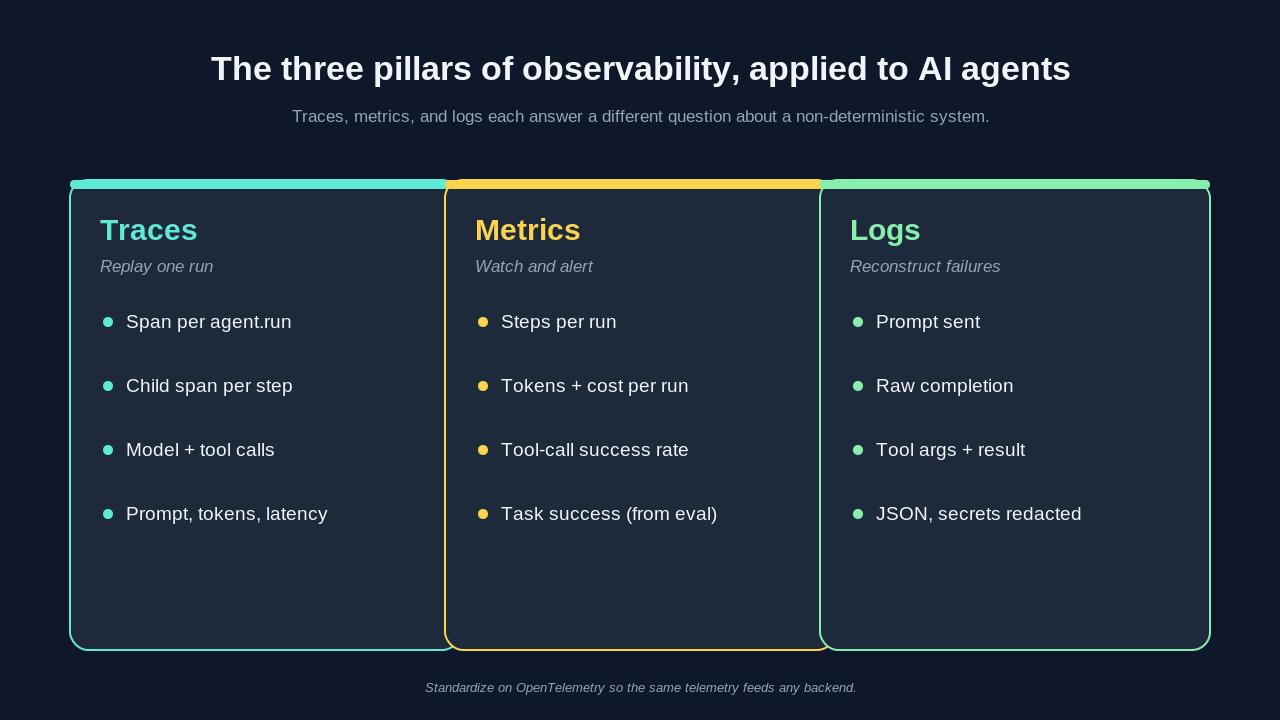
Observability rests on three kinds of telemetry. Each answers a different question, and for agents each needs a slightly different treatment than in a conventional backend.
Tracing agent runs
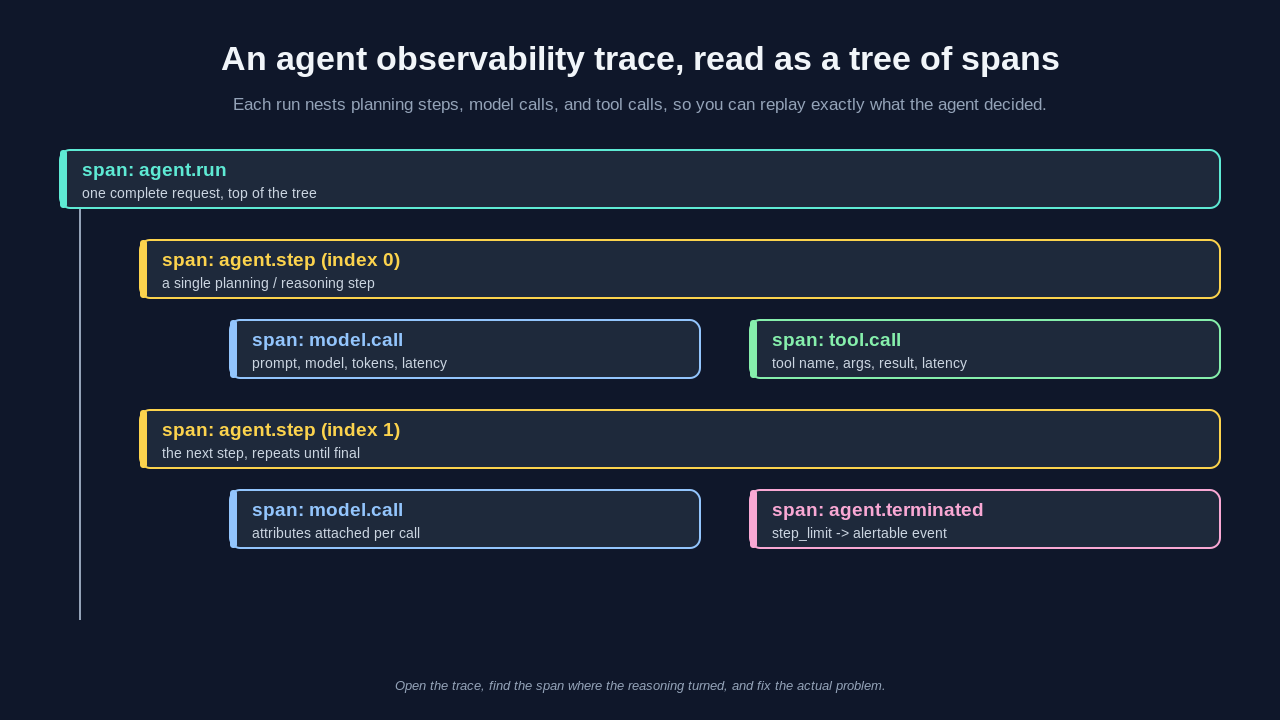
A trace is the single most valuable artifact in agent observability. It captures one complete run as a tree of spans: the top-level request, each planning step, every model call with its full prompt and completion, and every tool invocation with its arguments and result. Read top to bottom, a trace is a replay of the agent's decision-making.
The unit that makes this work is the span. In agent tracing you typically create a span for the overall agent invocation, child spans for each reasoning or planning step, and grandchild spans for the model and tool calls inside each step. Attach the prompt, the model name, the token counts, and the latency to each span as attributes. When something goes wrong, you open the trace, find the span where the reasoning turned, and read exactly what the model saw and decided.
Distributed tracing standards like OpenTelemetry already model this tree structure well, which is why most agent observability tools speak it natively. You do not need to invent a new format. You need to map agent concepts onto spans and attributes.
Metrics that matter for agents
Metrics are the aggregate numbers you watch on a dashboard and alert on. Generic service metrics like request rate and error rate still apply, but agents introduce a set of their own that are far more diagnostic.
Track steps per run, because a rising average is the earliest signal of runaway loops or degrading planning. Track tokens per run and cost per run, split by model, because these drive both your bill and your latency. Track tool-call success rate separately from overall run success, since a healthy-looking completion can hide a string of failed tool calls. Track time to first token and end-to-end latency, because agents chain many calls and latency compounds. Finally, track a task-level success metric derived from evaluation rather than from HTTP status, since only an eval knows whether the answer was actually correct.
Structured logging for reasoning steps
Logs fill the gaps traces and metrics leave. For agents, the highest-value logs are structured records of each decision point: the prompt sent, the raw completion received, the tool selected, the arguments passed, and the result returned. Log these as JSON, not free text, so you can query them later.
The discipline that pays off is logging inputs and outputs at every boundary. When a tool returns bad data and the agent reasons forward on it, the only way to catch the root cause is to have the tool's raw output on record. Redact secrets and personal data before they land in your logs, but keep enough of the payload that a failed run is reconstructable.
Instrumenting an agent with OpenTelemetry
Enough theory. Here is what basic instrumentation looks like in practice. OpenTelemetry is the vendor-neutral standard, and instrumenting your agent against it means you can send the same telemetry to almost any backend later without rewriting your code.
from opentelemetry import trace
from opentelemetry.sdk.trace import TracerProvider
from opentelemetry.sdk.trace.export import BatchSpanProcessor
from opentelemetry.exporter.otlp.proto.http.trace_exporter import OTLPSpanExporter

trace.set_tracer_provider(TracerProvider())
trace.get_tracer_provider().add_span_processor(
    BatchSpanProcessor(OTLPSpanExporter(endpoint="https://your-collector/v1/traces"))
)
tracer = trace.get_tracer("my-agent")

def run_agent(user_input: str) -> str:
    with tracer.start_as_current_span("agent.run") as run_span:
        run_span.set_attribute("agent.input", user_input)
        step = 0
        while step < MAX_STEPS:
            with tracer.start_as_current_span("agent.step") as step_span:
                step_span.set_attribute("agent.step_index", step)
                decision = call_model(user_input)          # child span inside
                step_span.set_attribute("agent.action", decision.action)
                if decision.action == "final":
                    run_span.set_attribute("agent.steps", step + 1)
                    return decision.output
                result = call_tool(decision.tool, decision.args)  # child span
                step += 1
        run_span.set_attribute("agent.terminated", "step_limit")
        return "step limit reached"
The call_model and call_tool helpers each open their own span and record token counts, latency, and the raw payloads as attributes. The result is a clean trace tree for every run. Notice the agent.terminated attribute on the step-limit path: that single line turns an invisible runaway loop into a queryable, alertable event.
Once spans carry token counts, deriving cost metrics is a matter of multiplying by your model's per-token price and exporting the number as a counter. From there your dashboard and alerts fall out naturally.
Debugging common failure modes with traces
Instrumentation only pays off when you use it to diagnose real problems. Here is how the failure shapes from earlier show up once you have traces.
For a runaway loop, sort runs by step count and open the worst offender. The trace turns root cause analysis from guesswork into reading: it will show the same tool being called repeatedly with slightly different arguments, or a planner that never emits a final action. The fix is usually a clearer stopping condition in the prompt or a hard step budget, both of which you can now measure before and after.
For a silent tool failure, the trace shows a tool span returning an error payload followed by a model span that cheerfully incorporates it. The signature is a successful run built on a failed tool call. Add validation on tool outputs and, in the trace, assert that error payloads short-circuit the run instead of feeding forward. This kind of defensive design connects directly to broader AI agent orchestration patterns that govern how components hand off control.
For context drift, read the trace from the top and watch the prompt grow. When the later steps stop referencing the original goal, you have found your window limit. Summarize intermediate results or prune the context, then re-run and compare. Correctness here is best measured with a proper evaluation harness rather than by eye, a topic we cover in our post on AI agent evaluation metrics.
Monitoring cost and token usage
Cost is the metric teams most often forget until it hurts, and it belongs at the center of any AI agent monitoring setup. Every model call has a price, and agents make many calls per request. A modest change, switching to a larger model or adding a reflection step, can multiply your bill without any visible change in behavior.
Instrument token counts on every model span, then aggregate cost per run, per user, and per agent version. Set a budget alert so a regression pages you the same day rather than at the end of the billing cycle. Watching cost per successful task, rather than raw cost, keeps the number honest: a cheaper agent that fails more often is not actually cheaper.
The agent observability tooling landscape in 2026
You do not have to build all of this yourself. A healthy ecosystem of platforms now specializes in agent and LLM telemetry, and most of them consume OpenTelemetry data so your instrumentation stays portable.
Purpose-built LLM and agent observability platforms give you trace visualization tuned for reasoning steps, evaluation integration, and cost dashboards out of the box. General-purpose observability suites increasingly ship LLM modules that fold agent traces into the same pane of glass as the rest of your infrastructure. Open-source options let you self-host when data residency or cost rules out a SaaS.
Choosing among them comes down to a few questions: does it ingest OpenTelemetry so you avoid lock-in, does it support evaluation alongside tracing, and does it surface cost as a first-class metric. For a detailed side-by-side, our comparison of LLM observability tools breaks down where each option fits.
Bringing it together
Agent observability is not a nice-to-have you bolt on after an incident. It is the difference between an agent you can operate and one you merely hope keeps working. Start with tracing, because a good trace tree answers most questions on its own. Add the agent-specific metrics that expose loops, cost, and silent failures. Log inputs and outputs at every boundary so failed runs are reconstructable. Standardize on OpenTelemetry so your telemetry outlives any single vendor.
Do that, and the next time an agent returns a confident wrong answer at 2 a.m., you will not be guessing. You will open the trace, find the span where the reasoning turned, and fix the actual problem. If you are still designing the surrounding system, the Levelop blog has a full cluster on agent orchestration, memory, and reliability to build on.
Frequently asked questions
What is the difference between agent observability and monitoring?
Monitoring tells you that something is wrong by watching predefined metrics and firing alerts. Observability lets you ask why it is wrong after the fact by exploring rich telemetry you did not have to anticipate. For agents, monitoring catches the cost spike; observability, through traces and logs, tells you which reasoning step caused it. You need both, and observability is the harder half to retrofit, so build it in early.
Do I need special tools, or can I use my existing APM?
Your existing application performance monitoring can be a starting point, especially if it now offers an LLM module, but generic APM was built for deterministic request paths and misses agent-specific signals like steps-per-run, token cost, and reasoning traces. Instrumenting with OpenTelemetry lets you feed both your APM and a purpose-built agent observability platform from the same code, so you are not locked into either.
How do I trace an agent without leaking sensitive data?
Redact secrets and personal information before attributes are attached to spans or written to logs. Most teams run a scrubbing step on prompts and tool payloads that masks tokens, keys, and identifiable fields while preserving enough structure to debug. Keep raw payloads only in access-controlled backends, and set retention windows so sensitive traces do not linger longer than you need them.
What metrics should I alert on first?
Start with three: cost per run, steps per run, and task success rate. A jump in cost or steps is the earliest warning of loops or a bad prompt change, and a drop in task success catches correctness regressions that HTTP status codes hide. Add tool-call success rate soon after, since a passing run can mask a string of failed tool calls.
How does agent observability relate to evaluation?
They are complementary. Evaluation scores whether an agent's outputs are correct, usually on a fixed test set, while observability shows what happened inside any given run in production. In practice you wire them together: traces provide the raw runs, and evaluation labels them so your success metric reflects real quality rather than surface-level completion. Together they turn a black box into a system you can measure and improve.
References
- OpenTelemetry, Traces concepts, opentelemetry.io/docs/concepts/signals/traces.
- OpenTelemetry, Semantic conventions for generative AI systems, opentelemetry.io/docs/specs/semconv/gen-ai.
- Google, Site Reliability Engineering, Monitoring Distributed Systems, sre.google.
- Cindy Sridharan, Distributed Systems Observability, O'Reilly, 2018.