LLM Observability: Tracing and Monitoring AI Agents in Production
The feature passed every test. It sailed through the demo and shipped on a Friday. By Monday, tickets were piling up. The assistant was giving confident, wrong answers to a question it used to handle fine. Nothing crashed. No exception fired. No dashboard turned red. The system was healthy by every normal measure and broken by the only one that mattered.
This is the gap LLM observability closes. When the failure is a plausible wrong answer, not a stack trace, your usual monitoring is blind. You hear about it from users instead of your tools. This guide covers what LLM observability is, why it differs from normal monitoring, the traces and metrics that matter, and the tools to use in 2026. It is the production half of the story we tell in our guide to what LLM evaluation is.
What is LLM observability?
LLM observability is the practice of instrumenting a language-model app so you can see what it actually did in production. That means every prompt, every token, every tool call, every retrieval, and every dollar. It lets you debug failures, measure quality, and control cost while the system is live.
Think of it as watching a decision, not just a server. Normal monitoring tells you the request returned a 200 in 240 milliseconds. LLM observability tells you the model read the wrong clause and wrote a fluent answer that was subtly wrong, all while returning a healthy 200. The HTTP layer was fine. The decision was not.
Why it differs from traditional monitoring
Three things break the usual assumptions. First, outputs are not repeatable. The same input can give different answers, so one log line proves little. You have to watch how quality spreads across many calls.
Second, failures are about meaning, not crashes. A model hallucinates a citation, drifts off topic, or ignores an instruction. None of that trips an error handler. You only see it if you capture the content and score it, which is why LLM evaluation and observability go together.
Third, cost is a live signal. Tokens cost money on every call. A prompt that adds context, or an agent that loops twice more, can multiply your bill with no change in latency. Production LLM monitoring tracks tokens and dollars next to speed.
Traces, spans, and metrics
LLM observability uses the same building blocks as the rest of modern observability, borrowed from OpenTelemetry. A span is one unit of work: a model call, a retrieval, or a tool call. It records model-specific data like the prompt, the tokens, the latency, and the cost.
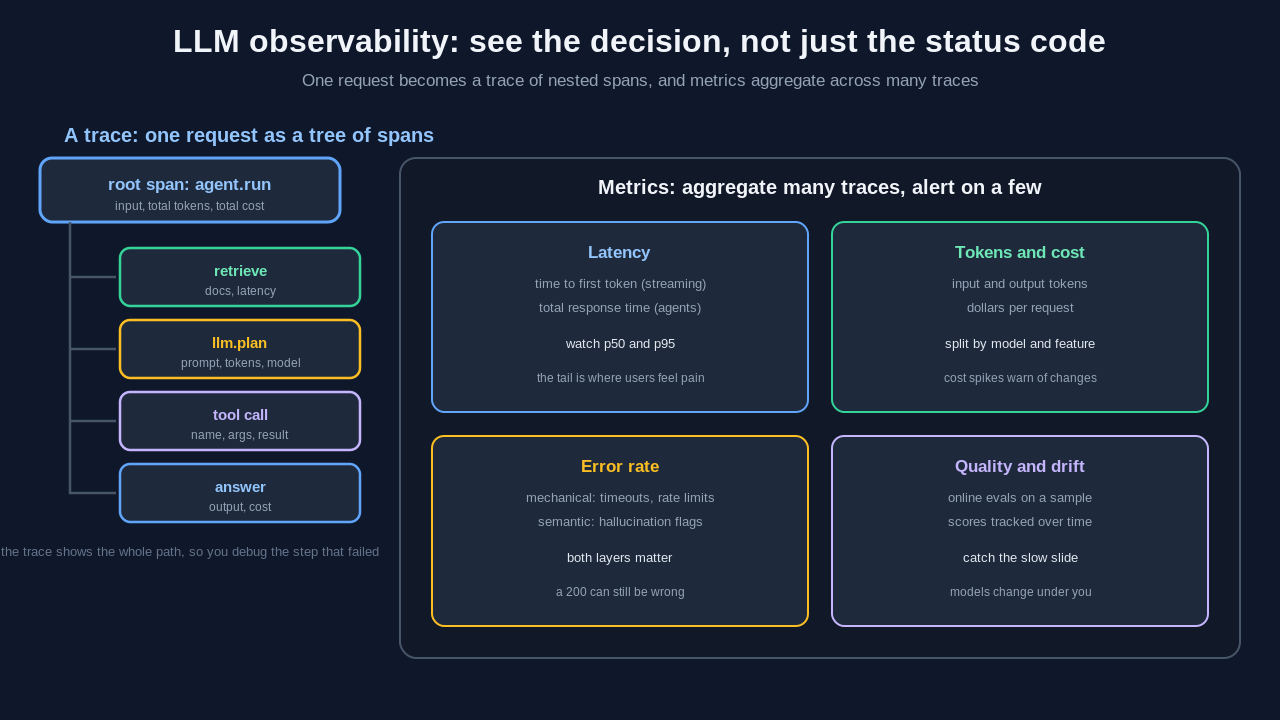
A trace is the full tree of spans for one request. For a chatbot it may be a single span. For an agent it is a deep tree: the plan, each retrieval, each tool call, and the final answer. The trace is what you actually debug, because it shows the whole path. This is the same trajectory idea behind AI agent evaluation, captured live.
Metrics are the totals you compute over many traces. A single span usually looks like this.
# One LLM call captured as an observability span
span = {
    "name": "chat.completion",
    "model": "claude-sonnet-4-6",
    "prompt_tokens": 1840,
    "completion_tokens": 210,
    "cost_usd": 0.0094,
    "latency_ms": 1320,
    "metadata": {"user_id": "u_2291", "version": "v14"},
}
Store that for every call. Now you can ask which model version is slowest and which prompts cost the most.
The metrics that matter in production
Watch a small set of signals, not everything. Track latency, or response time, as two numbers: time to first token for streaming, and total time for agents. These performance metrics show where users feel pain. Watch tokens and cost per request, split by model and feature, so a costly change has nowhere to hide.
Track error rate on both layers. That means real errors like timeouts, plus meaning-level failures like hallucination flags from online checks. Add quality scores from running evals on live traffic, often with the LLM-as-a-judge pattern on a sample of traces. Finally, watch drift. Models and inputs change under you, so a system that scored well at launch can slip with no deploy on your side.
LLM tracing: following a request through an agent
LLM tracing captures the full path of one request. It is where agents make the difference. A one-shot call barely needs a trace. An agent that plans, retrieves, calls three tools, and answers is almost impossible to debug without one. When the system you trace is an agent, this practice is called ai agent observability.
You instrument by wrapping each step in a span and letting the spans nest into a trace. Most teams use a tracing SDK or OpenTelemetry's GenAI conventions, which name the spans the same way across tools.
With that in place, a failing request stops being a mystery. You open its trace and see what was retrieved, what the plan was, and where it went wrong. That is also the visibility that context engineering needs, since you cannot fix a context window you cannot see.
LLM observability tools in 2026
You do not have to build this yourself. LangSmith pairs deep tracing with built-in evaluation and fits the LangChain stack. Langfuse is open source and observability-first, with traces, cost, and evals in one dashboard you can self-host. Arize Phoenix is built on OpenTelemetry with a focus on tracing and drift, and runs locally too. Helicone sits as a proxy in front of your provider, so you can capture cost and latency with almost no code change.
Most of these double as ai agent observability platforms, and the wider category is often just called ai observability. An agent is just the hardest thing they have to trace. Underneath them is one standard, OpenTelemetry's GenAI conventions, so picking a tool that speaks it is cheap insurance against lock-in. The best llm observability tools also let you pull a failing trace straight into your offline tests, so an incident becomes a permanent test.
How to set up LLM observability
Start with traces, because everything else builds on them. Wrap your model calls, retrievals, and tool calls in spans. Then capture cost and latency, which come almost for free once tracing exists. Next, add online evaluation on a sample of traffic so quality is a live signal. Finally, alert on the few metrics that matter: a cost spike, an error jump, or a quality drop. Build it in that order and each layer pays for the next.
Conclusion
LLM observability turns a model in production from a black box into a system you can see. The shift is small but real. Stop asking only whether the service is up. Start asking whether the answers are good, the cost is sane, and the agent's path made sense. Normal monitoring answers the first question and is silent on the rest, and the rest is where ai systems fail. Start with tracing, add cost and latency, then layer in quality scores. For the offline half of this, read our guide to LLM evaluation, and find more guides on the Levelop blog.
Frequently asked questions
What is the difference between LLM observability and LLM evaluation?
Evaluation scores model outputs offline, before you ship. Observability instruments the live system so you can see what it does in production: traces, tokens, cost, and errors. They meet when you run evals on production traces. Mature teams do both.
What is LLM tracing?
LLM tracing records one request as a tree of spans, each with its inputs, tokens, and latency. For a simple call the trace is one span. For an agent it shows the plan, every tool call, and the final answer. It is what lets you debug a multi-step agent, since it shows which step failed.
What metrics should I monitor for an LLM app in production?
Start with latency, token cost per request, and a combined error rate that covers real errors and meaning-level ones. Add quality scores from online evaluation on a sample, and watch all of them over time to catch drift. Latency, cost, and error rate are the minimum.
What are the best LLM observability tools in 2026?
Common picks are LangSmith, Langfuse, Arize Phoenix, and Helicone. Most emit OpenTelemetry GenAI data, so prefer one that follows the standard to avoid lock-in. The right choice depends on your stack and whether you need self-hosting.
Do I need LLM observability for a simple chatbot?
Yes, because the failures that hurt, wrong answers and rising cost, are invisible without it. A simple app may only need cost, latency, and a sampled quality score. A multi-step agent needs full tracing to be debuggable at all.
Where to go next
LLM observability is the production pillar of a larger evaluation discipline. Read our guide to LLM evaluation, then explore LLM-as-a-judge and AI agent evaluation. For more developer guides, visit the Levelop blog or the Levelop home page.