
LLM Observability Tools in 2026: Arize Phoenix vs Langfuse vs Helicone vs AgentOps
Shipping an LLM feature is easy. Knowing why it broke in production is the hard part. A prompt that worked in your notebook starts hallucinating on real traffic, a retrieval step quietly returns garbage, token costs triple overnight, and your agent loops on the same tool call forty times before giving up. Every one of these failures reaches your users as a degraded user experience, yet traditional application monitoring was never built to see any of it. That gap is exactly what the current generation of LLM observability tools was built to close.
This guide compares four of the most widely adopted LLM observability tools in 2026: Arize Phoenix, Langfuse, Helicone, and AgentOps. These platforms, sometimes grouped under the broader label of AI observability tools, each take a different bet on how you should instrument, trace, and debug LLM applications. By the end you will know which one fits a solo prototype, which one scales to a production agent platform, and how they slot into a broader evaluation and LLM monitoring workflow.
What LLM observability actually means
Classic observability rests on three pillars: logs, metrics, and traces. LLM observability keeps those but adds a layer that generic APM tools cannot express. It captures prompts and completions, token usage and cost per call, latency at each hop, retrieved context in RAG pipelines, tool calls inside agents, and quality signals like hallucination or drift.
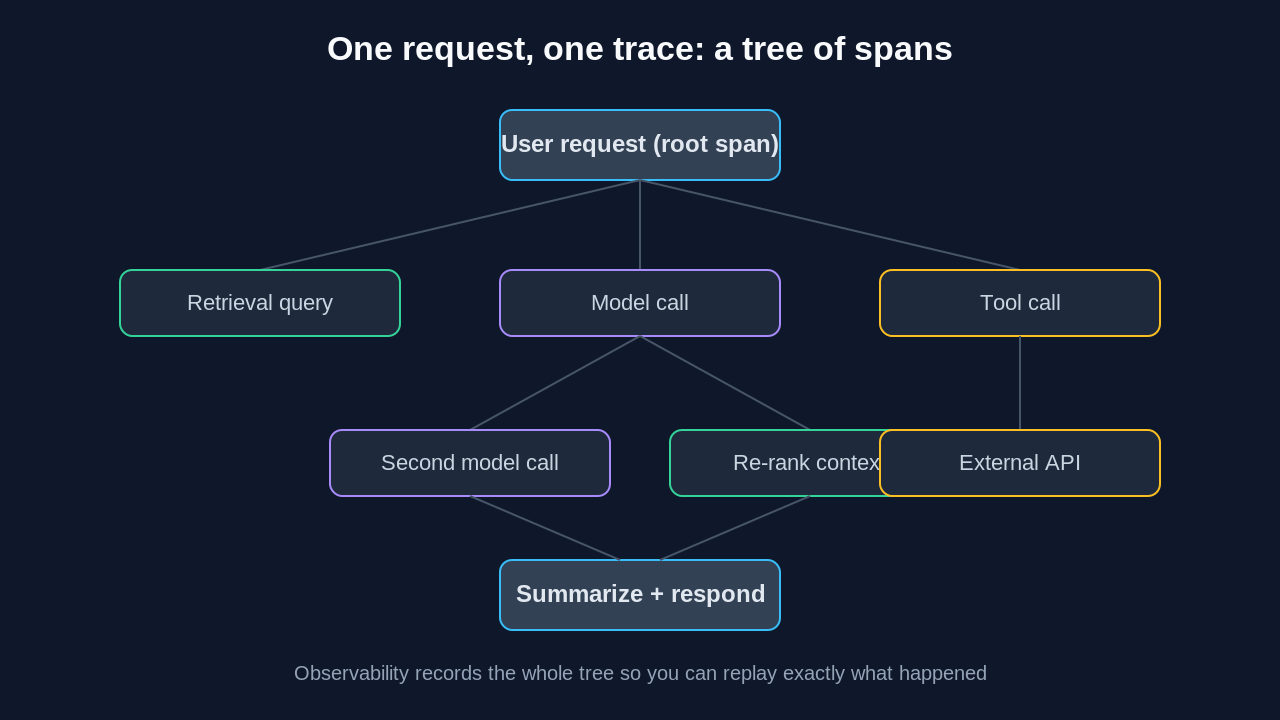
The unit of work is the trace. A single user request might fan out into a retrieval query, three model calls, two tool invocations, and a final summarization step. An LLM observability platform records that whole tree as connected spans so you can replay exactly what happened and where it went wrong. Most modern tools build on OpenTelemetry, which means your instrumentation is portable rather than locked to one vendor.
If you want the full conceptual foundation, our pillar guide on LLM observability, tracing, and monitoring AI agents in production walks through the architecture in depth. This post is the practical, tool-by-tool comparison layer on top of it.
The four tools at a glance
Before the deep dives, here is the short version of where each tool sits.
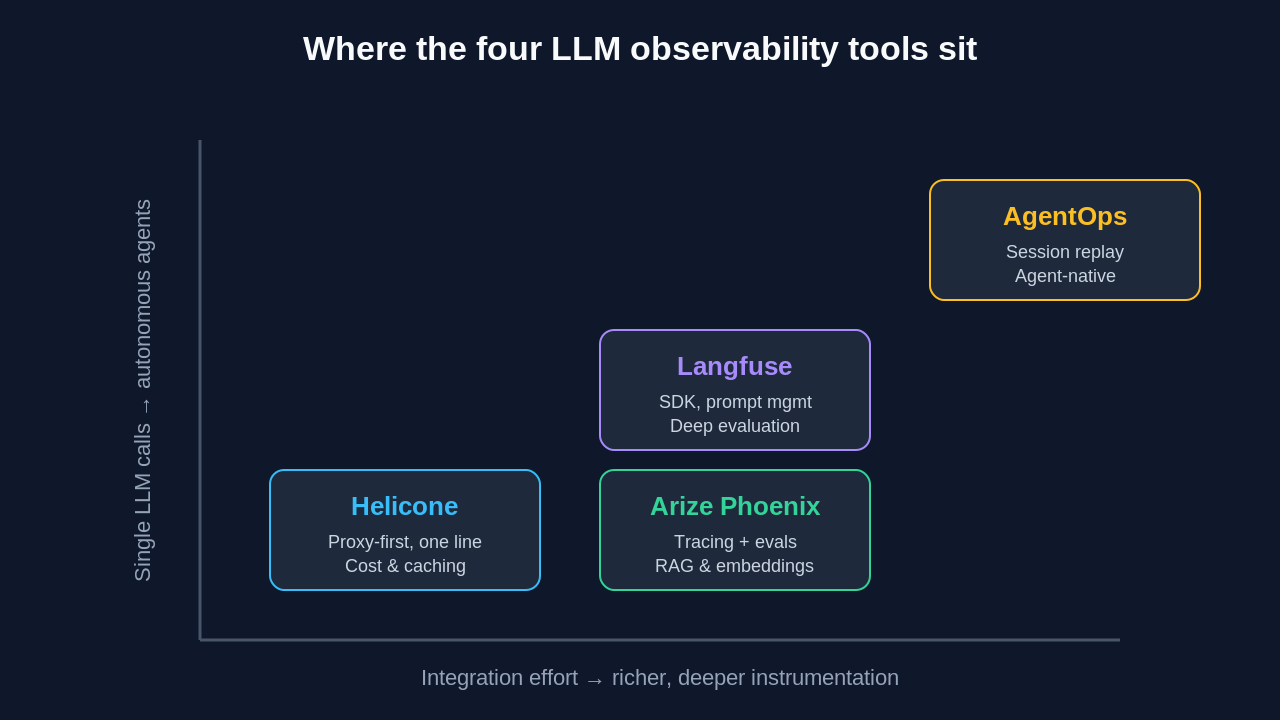
Arize Phoenix is the open-source, self-hostable platform for teams that want tracing plus evaluation without feature gates. Langfuse is the framework-agnostic open-source champion with the deepest prompt management and evaluation tooling. Helicone is the proxy-first option you can adopt in one line of code, strong on cost tracking and caching. AgentOps is purpose-built for autonomous agents, with session replay and time-travel debugging as first-class features.
Arize Phoenix: open-source tracing and evaluation
Phoenix, backed by Arize AI, has become the default open-source choice for many AI engineers. It ships four interconnected capabilities that form a tight loop: tracing, evaluation, dataset management, and a prompt playground. You trace what your app does, evaluate whether outputs meet quality thresholds, curate failure cases into datasets, then iterate on prompts before redeploying.
What sets it apart from generic monitoring is that it understands LLM-native concepts directly. Spans, embeddings, retrieved contexts, and model outputs are first-class objects in the UI rather than opaque JSON blobs. It includes built-in hallucination detection and embedding drift visualization, which makes it especially useful for teams iterating on retrieval pipelines.
Phoenix is built on OpenTelemetry, and the self-hosted core is genuinely free with no usage caps or feature gating. According to Arize, Phoenix has crossed 9,000 GitHub stars and 3M+ monthly downloads, and it runs locally in under a minute.
import phoenix as px
from phoenix.otel import register

# Launch the local Phoenix app and register a tracer
px.launch_app()
tracer_provider = register(project_name="my-rag-app")

# Auto-instrument your LLM SDK of choice
from openinference.instrumentation.openai import OpenAIInstrumentor
OpenAIInstrumentor().instrument(tracer_provider=tracer_provider)
Phoenix is a strong fit when you want an all-in-one, self-hosted tool and you care about the evaluation loop as much as raw tracing. If your workflow already leans on structured evals, pair it with the concepts in our guide to LLM evaluation for developers.
Langfuse: the framework-agnostic open-source standard
Langfuse is the other heavyweight in the open-source camp, and for many teams it is the reference implementation of LLM observability tools done right. It is self-hostable with no usage limits, framework-agnostic, and offers the most comprehensive prompt management and evaluation features of the four.
Its data model centers on traces and observations, with a prompt management system that versions prompts, tracks which version served which request, and supports A/B testing prompts in production. Evaluation can run through model-based scoring, human annotation queues, or custom scores pushed from your own pipeline. Langfuse showed moderate performance overhead in independent testing, around 15 percent, which is a reasonable trade for detailed tracing.
One notable development: Langfuse was acquired by ClickHouse in January 2026, with its current capabilities and open-source posture unchanged. That backing matters for teams betting on long-term maintenance.
from langfuse.openai import openai  # drop-in wrapper

# Calls made through this wrapped client are traced automatically
response = openai.chat.completions.create(
    model="gpt-4o",
    messages=[{"role": "user", "content": "Summarize the incident report."}],
    name="incident-summary",       # names the observation in Langfuse
    metadata={"feature": "summaries"},
)
Langfuse suits teams that want an open-source core they can self-host, plus serious prompt and evaluation tooling that will not force a migration as the system grows. Its instrumentation-based approach gives you more control than a proxy, at the cost of adding an SDK to each service.
Helicone: proxy-first observability in one line
Helicone takes the opposite philosophy. Instead of instrumenting your code with an SDK, you change your model provider base URL to route through Helicone's proxy. That one-line change gives you immediate logging, cost tracking, and latency metrics with essentially zero code churn.
import OpenAI from "openai";

const openai = new OpenAI({
  apiKey: process.env.OPENAI_API_KEY,
  baseURL: "https://oai.helicone.ai/v1", // route through Helicone
  defaultHeaders: {
    "Helicone-Auth": `Bearer ${process.env.HELICONE_API_KEY}`,
  },
});
The proxy layer unlocks features that are awkward to build yourself. Helicone can cache responses so a repeated prompt returns instantly without hitting the provider, which saves both money and latency. Its cost tracking computes spend per request from token counts and model pricing, then rolls that up into weekly summaries, per-model breakdowns, cost per custom property such as a user ID or feature name, and week-over-week comparisons that surface your most expensive requests.
The trade-off is architectural. A proxy sits in your request path, so it adds a network hop and becomes a dependency for every call. Teams with strict latency or reliability requirements should weigh that carefully, and deep multi-step agent tracing is less of a natural fit for a proxy than for an SDK that can capture nested spans. As with any fast-moving tool, check the current release activity and roadmap before you standardize on it.
AgentOps: built for autonomous agents
AgentOps is the specialist of the group. It is purpose-built for autonomous agent monitoring rather than single LLM calls, and it treats agent-specific problems as first-class concerns.
Its standout capability is session replay: a visual reconstruction of an entire agent run, including LLM calls, tool calls, decision points, and multi-agent interactions. Paired with time-travel debugging, you can rewind an agent run and replay it to see exactly where a reasoning chain went sideways. It also offers hierarchical span management for nested operations across multi-agent orchestrations, token and cost attribution across a wide range of models, an audit trail that flags errors and prompt-injection attempts, and real-time anomaly detection for unusual agent behavior. Independent testing put its overhead around 12 percent.
import agentops
from agentops import track_agent

agentops.init(api_key="YOUR_API_KEY", default_tags=["research-agent"])

@track_agent(name="researcher")
class ResearchAgent:
    def run(self, task: str) -> str:
        # tool calls and LLM calls inside here are captured in the session
        ...

# End the session so the full replay is recorded
agentops.end_session("Success")
If you are building multi-turn agents with tool use and complex state, AgentOps gives you debugging affordances the general-purpose tools do not. For single-prompt features, it is more than you need. This mirrors a broader theme in agent engineering that we cover in our writing on AI agent evaluation metrics, traces, and tool-calling tests.
How to choose
There is no single winner, because these tools optimize for different stages and shapes of workload. A few decision rules hold up well in practice.
If you want one self-hosted platform that does tracing and evaluation together, start with Arize Phoenix or Langfuse. Choose Phoenix if the embedding and retrieval visualizations matter to your RAG work, and Langfuse if prompt versioning and A/B testing in production are central. If you want observability with almost no code change and strong cost controls, reach for Helicone, ideally as a gateway layer rather than your only source of truth. If you are shipping autonomous agents and need to debug multi-step reasoning, AgentOps earns its place.
Two principles cut across all of them. First, prefer tools built on OpenTelemetry so your instrumentation stays portable. Second, remember that observability feeds evaluation. The point of capturing traces is to find failure cases, turn them into datasets, and measure improvement over time. Tools and teams that treat the two as one continuous loop ship more reliable systems than those that bolt on monitoring at the end.
Where Levelop fits
At Levelop we work with engineering teams putting LLM features into production, and the pattern is consistent: the teams that instrument early and close the observability-to-evaluation loop ship faster and break less. If you are standing up an evaluation and monitoring practice, our blog has a growing library on evals, agents, and production AI. Start with the LLM observability pillar guide and branch out from there.
Frequently asked questions
What is the difference between LLM observability and traditional APM?
Traditional application performance monitoring tracks metrics like CPU, memory, request latency, and error rates. LLM observability adds a layer for AI-specific signals: prompts and completions, token usage and cost, retrieved context in RAG pipelines, tool calls inside agents, and quality measures like hallucination and drift. The core unit is the trace, a connected tree of spans representing one request as it moves through models, retrieval, and tools.
Which LLM observability tool is best for a solo developer or prototype?
For the fastest start with minimal code, Helicone's proxy approach lets you add observability by changing one base URL. If you would rather self-host and keep everything local, Arize Phoenix runs on a laptop in under a minute and is free with no feature gates. Both are reasonable first choices before you commit to a heavier setup.
Are these LLM observability tools open source?
Arize Phoenix and Langfuse are open source and self-hostable with no usage caps on the core. Helicone offers an open-source option alongside its hosted service. AgentOps provides an SDK and a hosted platform. Always confirm the current license and hosting terms on each project's repository, since offerings evolve.
Do I need a separate tool for AI agents versus simple LLM calls?
Not always, but it helps for complex agents. For single-prompt features, Helicone, Langfuse, or Phoenix cover your needs. For multi-turn agents with tool use and state, a purpose-built option like AgentOps adds session replay and time-travel debugging that make multi-step failures far easier to diagnose. Many teams run a general tracer plus an agent-specific tool.
How does observability connect to LLM evaluation?
Observability captures what your system did; evaluation judges whether it was good. The strongest workflow treats them as one loop: trace production behavior, identify failure cases, curate them into evaluation datasets, then measure whether changes actually improve quality. A dedicated evaluation layer scores those traces so improvements are measurable.
References
- OpenTelemetry, the open standard for traces, metrics, and logs, opentelemetry.io.
- Arize Phoenix, open-source LLM tracing and evaluation documentation, docs.arize.com/phoenix.
- Langfuse, open-source LLM engineering platform documentation, langfuse.com/docs.
- Helicone, LLM observability and gateway documentation, docs.helicone.ai.
- AgentOps, agent observability and session replay documentation, docs.agentops.ai.