
Developer Productivity Metrics for AI Code Review ROI
Your team adopted an AI code review tool six months ago. It comments on pull requests, flags bugs, and suggests fixes. Leadership now wants a straight answer: is it worth the money? Most engineering leaders freeze at this question, because they never set up the developer productivity metrics that would let them answer it. They feel faster, but "feels faster" does not survive a budget review.
This guide fixes that. It walks through the code review metrics and developer productivity metrics that engineering teams use to prove AI code review ROI, how to combine them into a defensible model, and how to build a dashboard your team will trust. No vanity numbers, no lines-of-code theater. Just the signals that hold up when a CFO starts asking questions.
Why AI Code Review ROI Is Hard to Measure
AI code review sits in an awkward spot. It touches quality, speed, and developer experience all at once, so any single number understates its impact. Count only bugs caught and you miss the hours saved on review turnaround. Count only speed and you ignore the defects that never reached production.
There is also a baseline problem. Most teams never measured their review process before adding AI, so they have nothing to compare against. When someone asks whether review time dropped, the honest answer is often "we do not know what it was before."
The third trap is attribution. Codebases change, teams grow, and priorities shift. Isolating the effect of one tool inside all that noise takes deliberate measurement. You do not need a research lab. Engineering teams need a small set of developer productivity metrics collected consistently, plus a simple before-and-after window.
The Developer Productivity Metrics That Actually Matter
Frameworks like DORA and SPACE exist precisely because no single metric captures engineering performance or code quality. For AI code review specifically, five categories carry the weight. Track these and you can build an honest ROI story.
Review Cycle Time
Review cycle time is the clock that most directly reflects AI code review value. Break it into two sub-metrics: time to first review (how long a pull request waits before anyone or anything comments) and time to merge (how long from open to merged). AI reviewers respond in seconds, so time to first review usually drops hardest. That early feedback lets authors fix issues before a human reviewer even opens the PR.
Watch time to merge over a rolling four-week window. A healthy adoption curve shows first-review time collapsing almost immediately, then time to merge tightening over the following weeks as the team learns to act on AI feedback quickly.
Defect Escape Rate
Defect escape rate measures how many bugs slip past review into staging or production. This is where AI code review earns its keep on the code quality side, since high quality output is the real goal. Track the count of production defects per release or per thousand lines changed, and compare the trend before and after adoption.
Pair this with a related signal: issues caught in review versus issues caught later. Every bug an AI reviewer flags at the PR stage is a bug that did not become a production incident, a rollback, or a late-night page. Those avoided incidents are the single most valuable line in your ROI model, because a production defect can cost ten to a hundred times more to fix than one caught in review.
Review Coverage and Rework
Review coverage is the percentage of changed code that actually receives a review. Before AI, coverage often sags on small PRs, hotfixes, and late-Friday merges that reviewers wave through. An AI reviewer looks at everything, so coverage climbs toward 100 percent without adding human hours.
Rework rate, sometimes called change-failure-adjacent churn, tracks how often merged code has to be revised shortly after. Falling rework after AI adoption suggests the tool is catching real problems rather than generating noise. Rising rework is a warning sign that the team is merging AI-approved code without enough scrutiny.
DORA Metrics Connection
The four DORA metrics (deployment frequency, lead time for changes, change failure rate, and time to restore service) are the industry standard for delivery performance, backed by years of research from the DevOps Research and Assessment team. AI code review feeds two of them directly. Faster reviews shorten lead time for changes. Better defect catching lowers change failure rate.
You do not need to invent new measures here. If you already track DORA metrics, watch lead time and change failure rate specifically in the weeks after adopting AI review. Movement in those two is a clean, credible signal that leadership already understands.
Developer Experience
The SPACE framework, published by researchers from GitHub, Microsoft, and the University of Victoria, argues that satisfaction and well-being belong in any serious productivity picture. AI code review affects them in both directions. It removes tedious nitpicking from human reviewers, freeing them for architectural feedback. It can also frustrate developers if it floods PRs with low-value comments.
Measure developer experience with a short, recurring pulse survey: two or three questions about review quality and friction, asked monthly. A one-line net satisfaction score trending up is a legitimate part of ROI, even though it is qualitative. Ignore it and you risk optimizing speed while quietly burning out your senior reviewers.
Building an AI Code Review ROI Model
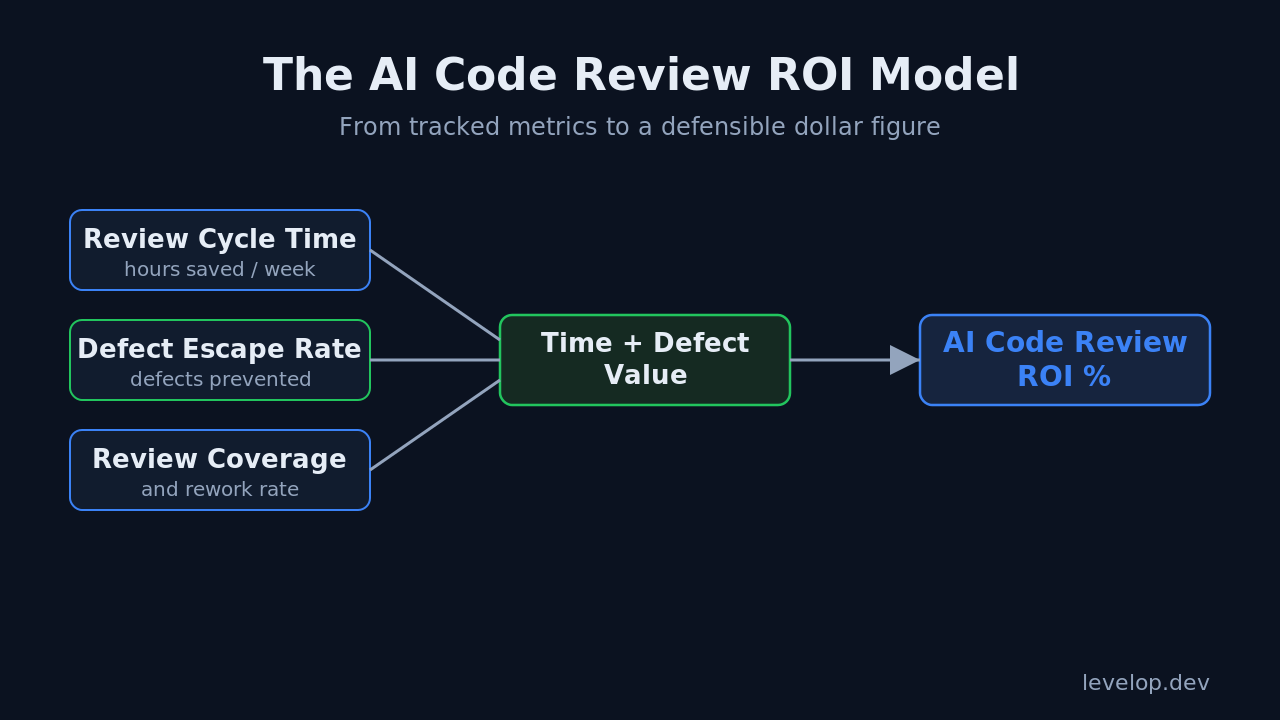
Once you have the developer productivity metrics above, ROI is arithmetic. The core formula uses hours saved and defects prevented, both drawn from the metrics you already track.
def review_roi(
    hours_saved_per_week,
    fully_loaded_hourly_cost,
    defects_prevented_per_month,
    avg_defect_cost,
    tool_cost_per_month,
    team_size,
):
    # Time savings from faster reviews and less manual nitpicking
    monthly_time_value = (
        hours_saved_per_week * 4.33 * fully_loaded_hourly_cost * team_size
    )
    # Value of defects caught in review instead of production
    monthly_defect_value = defects_prevented_per_month * avg_defect_cost
    total_benefit = monthly_time_value + monthly_defect_value
    net_benefit = total_benefit - tool_cost_per_month
    roi_percent = (net_benefit / tool_cost_per_month) * 100
    return {
        "net_benefit": round(net_benefit, 2),
        "roi_percent": round(roi_percent, 1),
    }
The two inputs that matter most are hours saved per week per developer and defects prevented per month. Both come straight from the developer productivity metrics you are already tracking. Hours saved falls out of review cycle time improvements. Defects prevented comes from the issues-caught-in-review count.
Be conservative with your assumptions. Use a fully loaded hourly cost that includes benefits and overhead, not just salary. For average defect cost, start with a modest internal estimate rather than a scary industry figure, so nobody can accuse the model of inflating results. A model that survives scrutiny beats a model with a bigger number.
A Practical Dashboard: What to Track Weekly
You do not need a data warehouse to start. A weekly snapshot of six numbers, pulled from your version control platform and CI, covers the essentials. Most of these come free from the pull request API.
-- weekly_review_metrics.sql
SELECT
    date_trunc('week', pr.merged_at)         AS week,
    count(*)                                 AS prs_merged,
    avg(pr.first_review_minutes)             AS avg_time_to_first_review,
    avg(pr.merge_minutes)                    AS avg_time_to_merge,
    sum(pr.ai_issues_flagged)                AS ai_issues_flagged,
    sum(pr.production_defects_linked)        AS defects_escaped,
    round(100.0 * count(*) FILTER (
        WHERE pr.was_reviewed) / count(*), 1) AS review_coverage_pct
FROM pull_requests pr
WHERE pr.merged_at >= now() - interval '12 weeks'
GROUP BY 1
ORDER BY 1;
Chart these six code review metrics over twelve weeks and the story tells itself. Time to first review and time to merge should trend down. AI issues flagged shows the tool is doing work. Defects escaped should trend down while review coverage trends up. When you present ROI, this chart is your evidence, and the formula above turns it into dollars.
Keep the collection automated. Manual metric gathering decays within a month because nobody has time to update a spreadsheet every Friday. A scheduled query that writes to a dashboard survives; a hand-maintained tracker does not.
Common Mistakes When Measuring AI Code Review ROI
The first mistake is measuring lines of code or comment volume. More AI comments is not better. A tool that leaves forty low-value notes per PR hurts developer experience and trains the team to ignore it. Weight quality of feedback over quantity.
The second mistake is skipping the baseline. If you only start measuring after adoption, you have no honest comparison. If you already missed that window, reconstruct a rough baseline from historical pull request data, which most platforms retain.
The third mistake is treating the tool as the only variable. Team growth, a big refactor, or a hiring freeze all move these numbers. Note major changes alongside your metrics so you can explain anomalies before someone else spots them.
The fourth mistake is ignoring the qualitative side. Numbers prove speed and defect reduction, but developer sentiment tells you whether the improvement is sustainable. A team that dislikes its review tooling will route around it, and the metrics will gradually mislead you.
For a deeper foundation on the practice itself, see the Levelop guide to AI code review for developers, and when you are ready to choose tooling, our comparison of the best AI code review tools breaks down what each platform actually measures. If you are still weighing whether to automate at all, our take on AI versus human code review covers where each one wins.
Frequently Asked Questions
What are the most important developer productivity metrics for AI code review ROI?
Review cycle time, defect escape rate, review coverage, the relevant DORA metrics (lead time and change failure rate), and a developer experience pulse. Together these cover speed, quality, and sustainability, which is everything ROI needs to account for.
How long before I can measure AI code review ROI?
Time-to-first-review improvements show within the first two weeks. Defect and rework trends need six to eight weeks to stabilize because they depend on release cycles. Plan to present a first honest ROI read at the eight-week mark.
Can I measure ROI if I never set a baseline?
Yes, though it is weaker. Reconstruct a baseline from historical pull request data, which GitHub, GitLab, and Bitbucket all retain. Use the three months before adoption as your comparison window and note that it is an estimate.
Do lines of code or number of AI comments matter for ROI?
No. Both are vanity metrics that reward volume over value. A tool that floods pull requests with trivial comments can lower real productivity even while these counts rise. Focus on cycle time, defects prevented, and developer sentiment instead.
How do DORA metrics relate to AI code review?
AI code review most directly affects lead time for changes and change failure rate. Faster reviews shorten lead time, and better defect catching lowers change failure rate. If you already track DORA metrics, watch those two after adoption for a credible ROI signal.
Turning Metrics Into a Decision
Proving AI code review ROI is not about finding one magic number. It is about tracking a small, honest set of developer productivity metrics against a baseline, converting them into time and defect value, and being conservative enough that the model survives a hard budget conversation. Do that and you will never freeze when leadership asks whether the tool is worth it.
Start with the six-number weekly dashboard, capture a baseline even if it is retroactive, and revisit the ROI model every quarter. For more engineering practices that hold up under scrutiny, explore the Levelop blog or learn what Levelop is building for teams that want to measure what actually matters.