

Back of the Envelope Calculation: 5 System Design Examples
Back with another one in the series where I break down system design ideas that took me a while to get. This time it is the part that used to make me freeze: the moment the interviewer asks "roughly how big does this need to be?"
For a long time I treated capacity estimation as a magic trick senior engineers performed, scribbling a few numbers, muttering "about 50,000 QPS", and moving on. The gap was not arithmetic. Nobody had shown me the compact set of anchor numbers and the repeatable method underneath the scribbling.
A back of the envelope calculation is a fast estimate using round numbers to check whether an idea is feasible. People also call it back of the envelope estimation, and in a system design interview it appears as capacity estimation system design, the same skill under different names. Here is the method and five worked examples that walk one chain: daily active users to query per second qps to storage to cache to network bandwidth.
The numbers worth memorizing
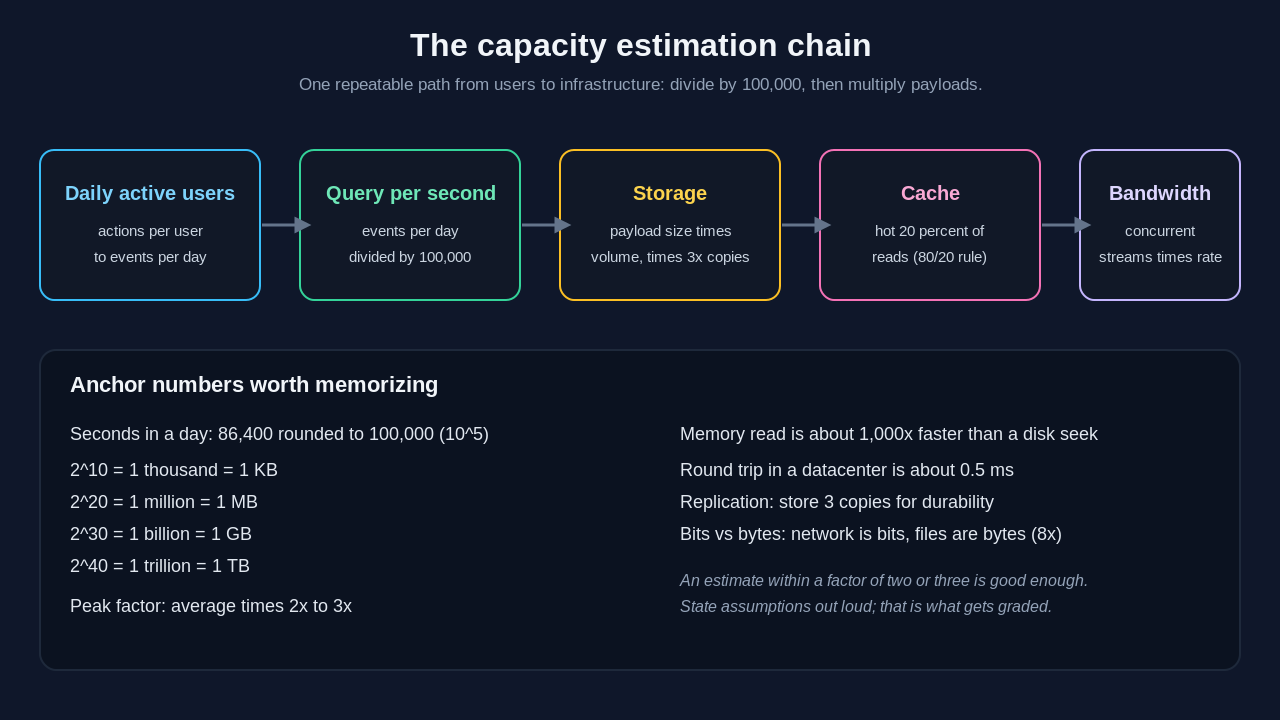
Seconds in a day is the anchor. There are 86,400 seconds in a day, rounded to 100,000 (10^5), so events per day divided by 100,000 yields the rough average per second.
1 day  ~= 86,400 s ~= 10^5 s
2^10 = 1 thousand -> 1 KB
2^20 = 1 million  -> 1 MB
2^30 = 1 billion  -> 1 GB
2^40 = 1 trillion -> 1 TB
A handful of latency numbers complete the toolkit. These derive from the latency numbers every programmer should know, often credited to Jeff Dean. Because a memory read is roughly 1,000 times faster than a disk seek, response time and overall system performance depend heavily on what each request actually touches.
How to run the estimate
State your assumptions out loud, because the interviewer grades your reasoning more than your final answer. Begin with daily active users, convert actions into events per day, divide by 100,000 for query per second qps, multiply payload sizes for storage and network bandwidth, then apply the 80/20 rule to size a cache. Here are five back of the envelope calculation examples drawn from real world software engineering systems.
Example 1: DAU to QPS for a feed
Assume 200 million daily active users, each refreshing a feed 20 times a day.
Reads/day = 200M x 20 = 4 x 10^9
Average QPS = 4 x 10^9 / 10^5 = 40,000/sec
Peak QPS = 40,000 x 2 = 80,000/sec
The read path serves roughly 80,000 query per second qps at peak traffic. That single figure forces you to identify potential bottlenecks early, since no single database survives that read load, which is why feeds depend on caching. I covered the options in caching strategies for system design.
Example 2: Storage for a photo service
Assume 500 million daily active users, 10 percent uploading 2 photos a day, each photo 2 MB after compression.
Photos/day = 500M x 10% x 2 = 10^8
Bytes/day = 10^8 x 2 MB = 200 TB/day
Per year = 200 TB x 365 ~= 73 PB
With 3x replication ~= 220 PB/year
The replication multiplier is the part candidates forget. You almost never store one copy, and thumbnails plus multiple resolutions add another 30 to 50 percent. Those are the system requirements that decide your storage tier.
Example 3: Cache sizing with the 80/20 rule
The 80/20 rule says roughly 80 percent of reads hit 20 percent of the content, so you size the cache to the hot 20 percent. Assume 100 million new tweets a day, each about 1 KB in cache.
Hot set = 20% x 100M = 20M items
Cache = 20M x 1 KB = 20 GB
Twenty gigabytes fits comfortably in memory on a modest Redis cluster. The Redis leaderboard build for 100 million players demonstrates this kind of in-memory sizing.
Example 4: Network bandwidth for video streaming
Assume 100 million daily active users, each watching one hour a day of 1080p video at 5 Mbps. Reason in concurrent streams rather than daily totals.
Avg concurrent = 100M hrs / 24 ~= 4.2M streams
Peak ~= 4.2M x 2.5 ~= 10M streams
Egress = 10M x 5 Mbps = 50 Tbps
Fifty terabits per second explains why streaming services cannot serve from a few origin servers. They push content to the edge, the architecture I described in how edge caching delivers responses in 40 ms.
Example 5: Tying the chain together
Take a messaging app: 2 billion users, 50 messages a day, each 100 bytes.
Messages/day = 2B x 50 = 10^11
QPS avg = 10^11 / 10^5 = 1,000,000/sec
QPS peak = 2,000,000/sec
Storage if kept = 10^11 x 100 B = 10 TB/day
A million messages per second average, two million at peak. Now the interviewer can probe the interesting follow ups about the overall system, and every answer connects back to a number you just produced.
Mistakes I made
I computed averages and stopped, then froze on peak load questions, so carry the peak factor to the end. I divided 86,400 by hand and wasted time, so round to 100,000. I forgot replication, which left storage off by 3x. And I confused bits with bytes on network bandwidth, an 8x error, so always say the units aloud.
What to practice next
Estimate QPS for a URL shortener at 100 million new links a month with a 100 to 1 read-to-write ratio. Estimate five years of storage for a drive service with 50 million users at 10 GB each. Estimate peak bandwidth for a live sports stream with 5 million simultaneous viewers at 8 Mbps. Each drill sharpens a different part of estimation in systems design.
Frequently asked questions
What is a back of the envelope calculation?
It is a quick estimate using round numbers to check whether an idea is feasible. In system design it means sizing load, storage, and network bandwidth fast enough to guide architecture, without aiming for exact precision.
How do you do a back of the envelope calculation for system design?
Start with daily active users and the actions each one takes. Convert actions per day to query per second qps by dividing by 100,000, multiply payload sizes for storage and bandwidth, apply a 2x to 3x peak factor, and use the 80/20 rule for caches.
Why divide by 100,000 instead of 86,400?
Rounding 86,400 to 100,000 makes the division trivial, and the resulting 14 percent error sits well inside the tolerance of an estimate, since your input assumptions are far rougher than that.
What numbers should I memorize for capacity estimation?
Seconds in a day as 10^5, powers of two mapped to data sizes, a peak factor of 2x to 3x, and the latency numbers every programmer should know. That compact set covers most estimation in systems design.
How accurate does a capacity estimate need to be?
Within a factor of two or three is enough. Interviewers grade whether you can reason about scale and identify potential bottlenecks, not whether your arithmetic is exact.
Where this came from
This came from the system design track on Levelop, where capacity estimation appears before almost every design question. You can find more breakdowns on the Levelop blog. For the source on the latency numbers, see the interactive version maintained by Colin Scott, and Alex Xu's System Design Interview for further practice.